
Start here
Learn the map in two minutes
Find a place, turn on the layers you need and tap a ready-made route. Drag to move the map; zoom with two fingers, the mouse wheel or the "+" and "−" buttons.
Essential cookies keep the site working. Yandex Metrica runs only with your consent. More details
Route on the map
 Track recording
The web map cannot reliably record a track in the background. The TrailTrack app keeps recording with the screen off and saves the route to your collection.
The TrailTrack iPhone app is not ready yet. Record the track with any GPS tracker, save it as GPX and upload it here — the route will appear on the map.
Map legend, layers and route building — from the first click to publishing.
Nothing found. Try a shorter query.
Find a place, turn on the layers you need and tap a ready-made route. Drag to move the map; zoom with two fingers, the mouse wheel or the "+" and "−" buttons.
Enter a city, address, place, route name or coordinates. The map zooms to the result and opens its card.
The "Layers" button opens everything the map can show: base map, routes, places, weather, terrain and the legend.
3D terrain, this guide and "My location". On a computer "Layers" and zoom are there too; the compass appears when the map is rotated.
Tap a route, park, peak or other place to open a card with a description, photos, coordinates and sources.
Checked catalog routes: markers and lines. Tapping a line or marker opens the route card.
Routes you created, saved and recorded. Turn them off if they make the map hard to read.
Water, overnight spots, shelters, picnic areas, parks and long-distance trails. Choose exactly what to show in "Layers".
Peaks, passes, viewpoints and lifts. They work on the flat map and in 3D.
Precipitation, wind, temperature and cloud cover over the map. The radar shows how precipitation moves over time.
Contour lines show height, hillshade the shape of slopes; 3D terrain tilts the map and raises the mountains.
Steps tick themselves as you do them on the map.
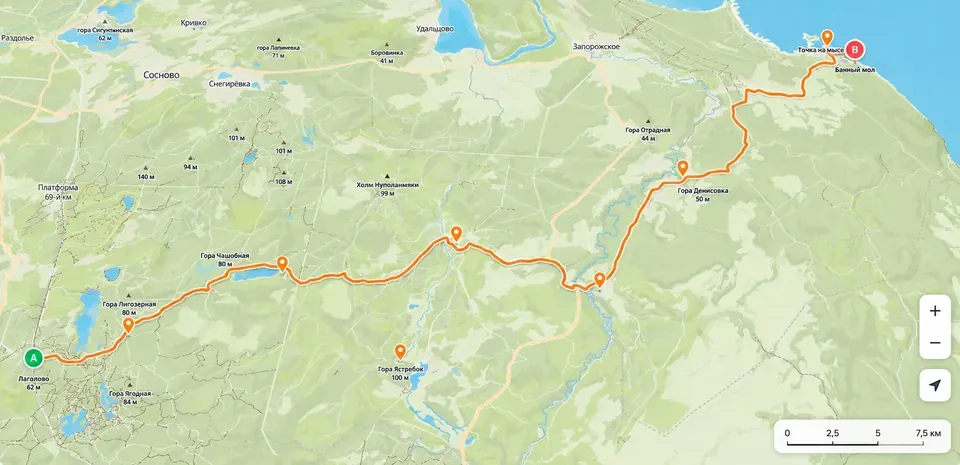
The highlighted line of the open route. Some sections may change colour with the surface.
A contrasting casing under the active route so the line stands out over forests and roads.
A blue dashed line is another option between two points. Select it to replace that section.
A dark dashed line is a warning: the section is drawn straight and does not confirm that it can be passed.
Show the direction of travel. They appear at a suitable zoom level.
Zoomed out — every 10 km, closer — every 5 km, at detailed zoom — every kilometre.
On the active route the colour comes from the routing data. On base-map trails the line pattern also helps tell surfaces apart.
A wide warm line with a contrasting outline. Roads for cars are deliberately muted.
A light solid line with a grey-beige edge.
A thin dashed line. Difficult sections are coloured: red for T3, dark red for T4, black dots for T5–T6.
The SAC scale from OpenStreetMap. T1–T2: an ordinary trail; T3: mountain (red dashes); T4: alpine (dark red); T5–T6: climbing and glaciers (black dots). Pale dots: the trail is hard to see on the ground.
A contour is a brown line of equal height. The number on it is the height above sea level.
A light blue line; lakes and seas are filled with light blue.
A translucent green area with a neat dashed edge; nature reserves and national parks have a darker, labelled border. A click highlights the whole area.
The name appears next to the icon when zoomed in enough. Click an icon to open its card.
The first point or the start of a stage.
The last point or the end of a stage.
Shapes the path but does not have to be a place of its own.
A bright highlight appears when you select a surface, a stage or a warning.
The planner builds a path along roads and trails, then lets you fix sections by hand and add places, stages and a description.
Walking, running, cycling, MTB, skiing, car, boat or a straight line. The profile sets the allowed roads and the speed.
You can change the activity later in the routing settings.Click the map at least twice. A calculated path appears between the points. New clicks extend the route.
Points can be dragged; the route is recalculated automatically.You can prefer trails or gravel and avoid roads, highways, stairs and private land.
Presets: “More nature”, “Quieter and safer”, “Easier going”.Drag an existing point or the line. For a section with no known road, use the “Straight line” tool.
A straight line does not guarantee a way through — check the satellite view and the terrain.The “Marker” tool adds a key point: water, a campsite, a viewpoint, a hazard or a photo spot.
You can give it a name, a description and photos.“Split” creates stages or days. Each stage keeps its own length, elevation gain and points.
Use “Loop” for a loop and “Reverse” for the opposite direction.Check the distance, elevation gain, surfaces and difficult sections. Black sections need special attention.
Zoom in and make sure the route does not cross water, a cliff or a closed area.Add a short description, the season, time, transport, parking, gear and warnings.
A good route answers the question “what do I need to know before I set off?”.Save a draft, create a route page or export GPX/KML/GeoJSON for your navigator.
Before publishing, double-check the direction, the points and the description.Zoom in: at overview scale only long, well-defined trails show; the full network appears from zoom 11–13.
In "Layers" → "Terrain": hillshade shows the shape of slopes, contour lines show height. The closer the contour lines, the steeper the slope. In 3D you can also tilt the map.
That is the contour’s height above sea level. Every point on one line is at the same elevation.
The colour shows the surface detected by the router: asphalt, gravel, dirt, sand and others. A grey dashed line means there is no reliable data.
The map hides overlapping labels and minor features so it does not turn into a mess. They come back when you zoom in.
Нажмите на территорию парка: выделение покажет его название и границу.
The card matches the place with open sources. Always check the name and coordinates; links to the sources are in the card.
The radar shows how precipitation actually moved over a short period, while the forecast shows the expected conditions at the selected point. They complement each other.
Make sure the points are near an accessible road or trail and the right profile is selected. For a section without a network, use “Straight line”, but be sure to check that it can be passed.
Add a waypoint with a click or drag the line onto the road you want. The more precisely the points are placed, the more stable the result.
Place the main points, then choose “More → Loop”. The planner adds a path from the finish back to the start.
Choose “Split” and click the line where you will spend the night. Separate stages appear, each with its own stats.
Surfaces come from the routing data and OpenStreetMap. Check the section against the satellite view and open sources, and report the error if needed.
Yes. Click “Import”, choose a GPX/KML/GeoJSON file, then edit its points and sections like any other route.
A personal route is visible only to its owner. In “Presentation” you can confirm submitting it to the shared catalogue: the route stays private until a moderator reviews it. A route with a published trip report appears in the catalogue automatically.
Yes. In a shared room participants suggest changes, vote and discuss the route in a group chat. The organiser confirms the final version.
Subscribe to our Telegram channel to hear about new routes, places and TrailTrack updates.
Subscribe on Telegram